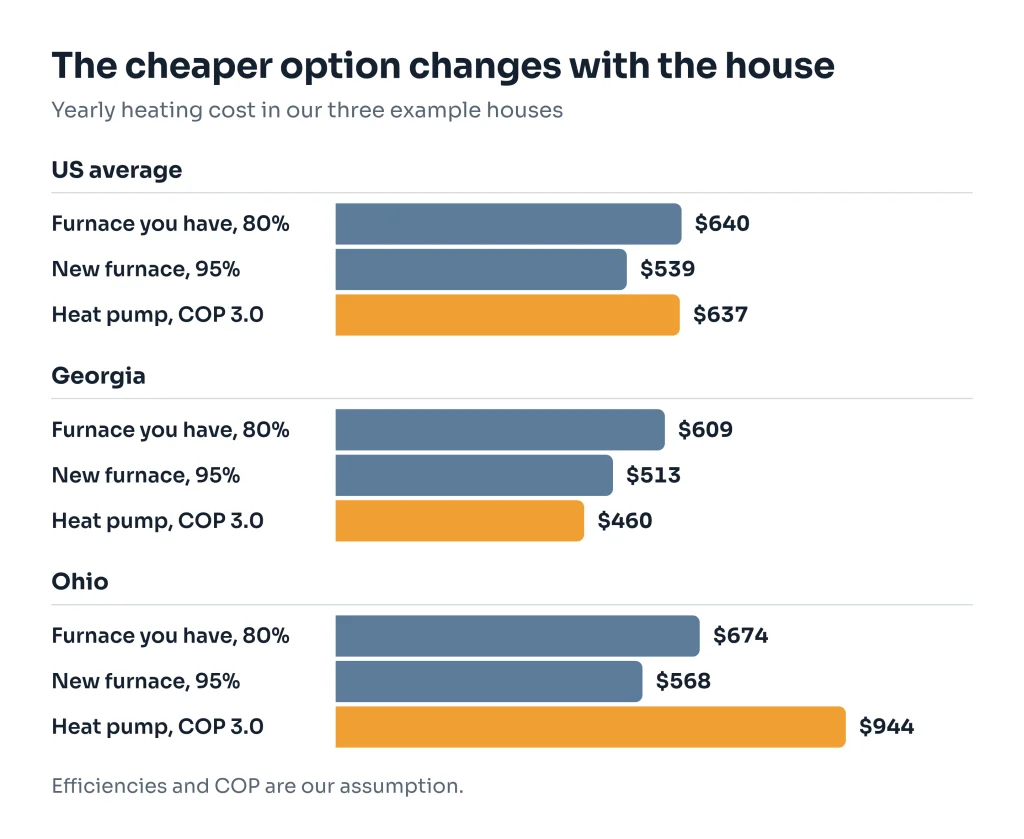
At US average prices, a heat pump with a seasonal COP of 3.0 costs about the same to run as an 80% gas furnace ($637 against $640 a year in our example) and about $98 a year more than a new 95% furnace. The furnace keeps its lead until the heat pump averages about 3.55 over the winter. That line, the break-even COP, falls to about 2.7 in Georgia and rises to about 5 in Ohio, so your local prices matter at least as much as the equipment. The calculator on this page runs the math on your own bills. It is part of our furnace or heat pump guides.
It counts running costs only, and either side can win. A negative saving means the furnace costs less to run, and that is a normal result. The Last Furnace sells and installs nothing, and this page has no affiliate links or paid placements.
What to enter
Pick your state and you get a full result straight away, from dated federal averages. Your own bills give a much better one. A state changes the prices only: the 449 therms stay until you enter your own gas use, so the yearly dollars are for a US-average home at your state’s prices.
- Gas for heating. Add up the gas on 12 months of bills, in the unit your bill uses: therms, ccf or Mcf. Then enter a typical summer month. The calculator takes 12 of those off, since summer gas is mostly water heating and cooking. The default, 449 therms, is the US average for space heating in homes heated with gas (44.9 million Btu in EIA’s RECS 2020). It is heating only, so its summer figure is 0.
- Your gas price. On a winter bill, take the total, subtract the fixed monthly charge, and divide by the units used. Enter 0 to use the winter average for your region.
- Your electricity rate. Do the same on a winter bill, using kWh. If your utility has a heat pump or winter rate, enter that, and check whether it applies to your whole bill or only part of it. Enter 0 to use your state’s average.
- Your furnace’s efficiency. AFUE is the share of the gas that reaches the house as heat. The gas on your bills was burned by the furnace you have, so that AFUE tells us how much heat the house really used. A second box sets the new furnace to compare against. The 80% and 95% here are our assumption, as examples. Use your own furnace’s label and the figure on your quote.
- Seasonal COP. This is heat delivered per unit of electricity, averaged across a whole winter. It drives the result and it is the hardest number to know, so it gets its own section below. The default of 3.0 is our assumption, and it isn’t a promise or a rating.
Four more boxes are optional. They cover the share of heat from electric backup strips, a fixed gas charge you would stop paying, any yearly cooling saving, and the extra install cost. All default to 0. No result here tells you what size to buy.
Reading the result
- Yearly saving. Two lines, one against the furnace you have and one against a new furnace. Positive means the heat pump costs less to run. Negative means the furnace costs less to run.
- Break-even seasonal COP. The COP at which the two cost the same at your gas and electricity prices. Compare it with the seasonal COP used, which includes any backup share. Above it, the heat pump is cheaper to run. Below it, the furnace is. The fixed charge and cooling boxes aren’t in this figure, so with those filled in, go by the saving lines.
- Break-even electricity rate. The rate at which a heat pump at your COP would tie a new furnace. It shows how far a cheaper winter or heat pump rate would have to go.
- Simple payback. Your extra install cost divided by the yearly saving against a new furnace. It shows 0 if you entered no extra cost, or if the heat pump saves nothing against a new furnace. In that second case there is no payback.
Compare the new-furnace line when your furnace needs replacing anyway. If it’s working and you’re only curious, read the line for the furnace you have, and remember that the whole cost of the heat pump is then in play, not just the extra.
The example, worked through
Three houses, all with the default efficiencies and COP, which are our assumption. The US column is the calculator as it opens. Georgia and Ohio use each state’s average heating gas from RECS 2020 (36.96 and 62.26 million Btu, rounded to therms), so to match those columns pick the state and enter that gas use.
| Step | US average | Georgia | Ohio |
|---|---|---|---|
| Gas for heating | 449 therms | 370 therms | 623 therms |
| Gas price, Q1 2026 (division) | $1.43/therm | $1.65/therm | $1.08/therm |
| Electricity, Aug 2026 | 18.16¢/kWh | 15.90¢/kWh | 19.38¢/kWh |
| Furnace you have, 80%: gas × price | $640 | $609 | $674 |
| Heat delivered: gas × 80% | 35.9 million Btu | 29.6 million Btu | 49.8 million Btu |
| New furnace, 95%: heat ÷ 95% × price | $539 | $513 | $568 |
| Heat pump electricity at COP 3.0 | 3,509 kWh | 2,892 kWh | 4,869 kWh |
| Heat pump: kWh × rate | $637 | $460 | $944 |
| Saving vs the furnace you have | $3 | $149 | −$270 |
| Saving vs a new furnace | −$98 | $53 | −$376 |
| Break-even COP vs 80% furnace | 2.99 | 2.26 | 4.20 |
| Break-even COP vs 95% furnace | 3.55 | 2.69 | 4.99 |
In the Ohio column, the furnace costs less to run at either efficiency, and by a lot. Gas is cheap there and the average home burns a lot of it, so the gap is wide. In the Georgia column, the heat pump costs less to run even against a new furnace, but the yearly sums are small because the home burns little gas. The US column is close to a tie against an old furnace. Change the COP by a few tenths and the sign flips.
The formula
All of this is our arithmetic, using these steps:
- Gas for heating = yearly gas − 12 × summer-month gas
- Cost of the furnace you have = gas for heating × gas price
- Heat delivered = gas for heating × AFUE of the furnace you have
- New furnace cost = heat delivered ÷ new AFUE × gas price
- Heat pump kWh = heat delivered in Btu ÷ (COP × 3,412)
- Heat pump cost = kWh × electricity rate
- Saving = furnace cost − heat pump cost + 12 × fixed gas charge + cooling saving
- Simple payback = extra install cost ÷ saving vs a new furnace
- Break-even COP = cost of 1 million Btu of electric resistance heat ÷ cost of 1 million Btu delivered by the furnace
The factors are EIA’s: 3,412 Btu per kWh, 100,000 Btu per therm and 1,036 Btu per cubic foot. EIA calls these sample factors, and your bill may print its own therm factor. A US example of the last line: 18.16¢ a kWh is $53.22 per million Btu of resistance heat. Gas at $14.77/Mcf is $14.26 per million Btu, or $15.01 delivered by a 95% furnace. $53.22 ÷ $15.01 = 3.55.
To do it on the back of an envelope: break-even COP ≈ rate in $/kWh × 29.3 × AFUE ÷ gas price in $/therm.
If you enter a backup share, the calculator blends the two: COP used = 1 ÷ ((1 − share) ÷ COP + share). At COP 3.0, a 10% backup share gives 2.50 and a 20% share gives 2.14. That is why the backup box matters.
Why we never use the latest gas price
A heat pump vs furnace tool that pulls the latest monthly gas price can give you the wrong winner. EIA’s monthly US residential price was $27.05/Mcf in August 2026, up from $16.16 in March. Over the winter, EIA’s Short-Term Energy Outlook (Table 5b) puts the first quarter of 2026 at $14.77. Nobody heats a house with August gas. Very little gas is sold in summer, so fixed charges are spread across few units and the average per unit climbs.
The effect is large. A 95% furnace costs $27.48 per million Btu delivered at the August price and $15.01 at the winter price. A heat pump at COP 3.0 and 18.16¢ costs $17.74. So the August price says the heat pump wins and the winter price says the furnace wins, with the same house and the same equipment.
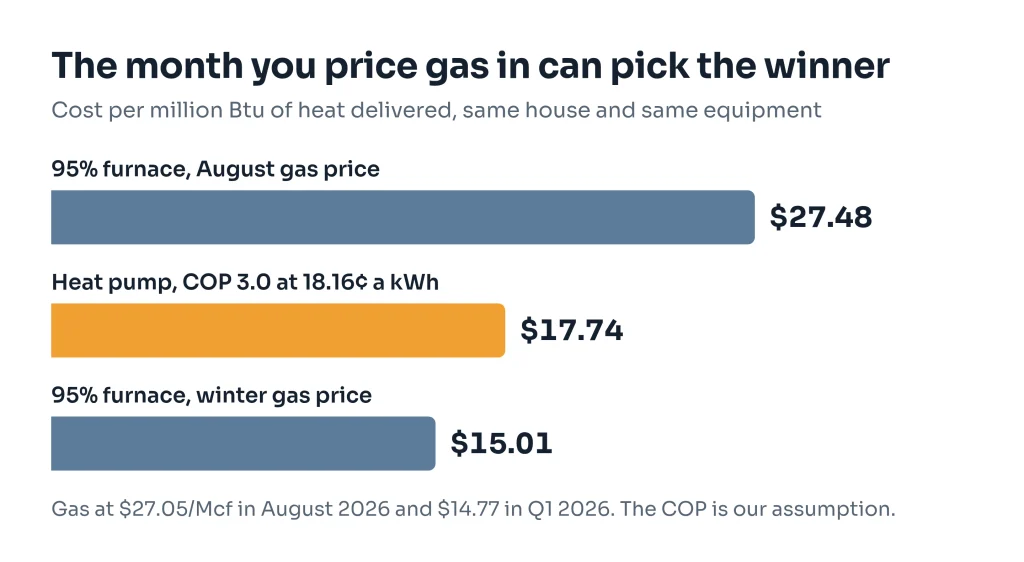
Our defaults are Q1 2026 by Census division, the last actual winter quarter in the October 2026 Outlook. They include fixed charges spread over winter use, so the per-unit price on your own bill will usually be lower, which favors the furnace. If you keep gas service, the fixed charge doesn’t go away. Electricity defaults are EIA’s August 2026 state averages (released 23 October 2026, preliminary). They include fixed charges too, which pulls the other way. August is a summer month. EIA’s Outlook has the US at 17.83¢ in Q1 2026, against that 18.16¢ for August, so the national gap is small. Some regions show a wider gap. West North Central paid 15.92¢ in August against 13.32¢ in Q1 2026, and East North Central 19.60¢ against 18.04¢ (August from the same EIA table, Q1 from Outlook Table 7c). New England went the other way, 28.31¢ against 29.57¢. A rate 8% to 16% lower pulls a break-even COP down by the same share, so the Midwest lines in the table below probably read high. We have no state winter rates here, which is another reason to use your bill. We recheck both figures monthly through the heating season.
Prices also move. On EIA’s own forecast for Q1 2027 ($13.20/Mcf and 18.34¢), the US break-even against a 95% furnace would be about 4.0 instead of 3.55. That is a forecast, and a new one is due on 10 November.
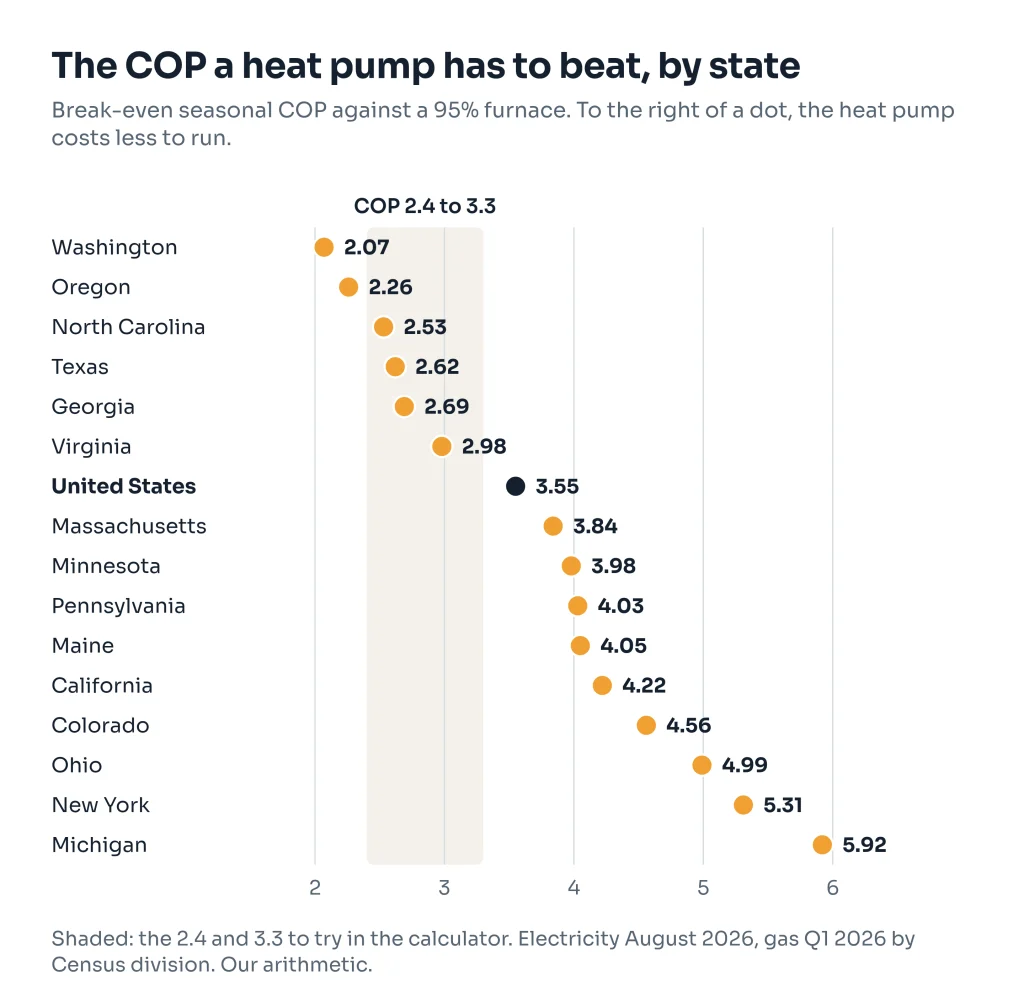
Break-even COP by state
Our arithmetic on the defaults above. Above the number, a heat pump costs less to run than that furnace. Below it, the furnace costs less.
| State | Electricity, Aug 2026 | Gas per therm, Q1 2026 (division) | vs 95% furnace | vs 80% furnace |
|---|---|---|---|---|
| Washington | 14.63¢ | $1.96 | 2.07 | 1.75 |
| Oregon | 15.92¢ | $1.96 | 2.26 | 1.90 |
| North Carolina | 14.95¢ | $1.65 | 2.53 | 2.13 |
| Texas | 15.91¢ | $1.69 | 2.62 | 2.21 |
| Georgia | 15.90¢ | $1.65 | 2.69 | 2.26 |
| Virginia | 17.64¢ | $1.65 | 2.98 | 2.51 |
| United States | 18.16¢ | $1.43 | 3.55 | 2.99 |
| Massachusetts | 30.48¢ | $2.21 | 3.84 | 3.24 |
| Minnesota | 17.20¢ | $1.20 | 3.98 | 3.35 |
| Pennsylvania | 21.77¢ | $1.50 | 4.03 | 3.40 |
| Maine | 32.11¢ | $2.21 | 4.05 | 3.41 |
| California | 29.75¢ | $1.96 | 4.22 | 3.55 |
| Colorado | 17.17¢ | $1.05 | 4.56 | 3.84 |
| Ohio | 19.38¢ | $1.08 | 4.99 | 4.20 |
| New York | 28.65¢ | $1.50 | 5.31 | 4.47 |
| Michigan | 22.99¢ | $1.08 | 5.92 | 4.98 |
Treat this as a starting point. Gas prices here are for a Census division, not a state, because that is how EIA’s Outlook reports its quarterly figure. Washington and Oregon share the Pacific division with California, and Colorado shares Mountain with Arizona, so a real bill can land a long way from this line. Our furnace guide reruns each state on its own gas price, and Oregon’s 2.26 against a 95% furnace becomes 2.92 there. The calculator covers 48 states and DC. Alaska and Hawaii aren’t listed, so choose the US average and enter your own prices.
What COP to try
Nobody can give you a seasonal COP in advance, and a single figure hides what cold weather and backup heat do.
- Ratings. HSPF2 ÷ 3.412 turns a rating into a COP for that test. The federal minimum for a split-system heat pump, 7.5 HSPF2, works out to 2.20. A rating of 8.5 gives 2.49, and 11.1 gives 3.25 (our arithmetic). These come from a rating test, so they aren’t a forecast for your house.
- A state program’s assumption. Efficiency Maine’s brochure (as of 11 September 2026) uses COP 3.15 for its propane comparison. That is its assumption, and it comes from a program that promotes heat pumps.
- British Columbia field study. RDH measured 26 systems at 24 homes for a year from April 2019 and estimated average seasonal heating COPs of 2.4 for ductless, 2.6 for central single-stage and 3.3 for central variable-speed. The central figures count electric backup. Without it they were 3.2 and 3.5, and at one home backup took the figure from 3.8 to 1.4. Most central systems cut back or stopped between 3°C and −5°C (about 37°F and 23°F) and relied on backup. It’s a mild-to-cool climate and a small sample: the 3.3 rests on two systems.
- New England field study. A Building America team monitored ductless units at seven sites in Connecticut, Massachusetts and Vermont in winter 2013-14 and found site COPs from 1.1 to 2.3, about ±21%. Causes included low airflow, placement and how the unit worked alongside other heat. Most were used as supplemental heat, the equipment is now over a decade old, and the report says its results aren’t comparable to rated performance.
None of these is what your home will get, and none is a US average. Run the calculator at 2.4 and at 3.3, with the backup box at 0, because the central figures already count backup. If the same side wins at both, you have your answer on running cost. If the winner changes, the COP is the question to put to the installer. Ask what seasonal COP they expect in your climate, and how much of the winter will run on backup heat.
When a furnace is the better call
On running cost alone, these are the cases where the numbers favor the furnace:
- Your break-even COP is above about 3.5. That covers the US average against a 95% furnace and, on our August power prices, the Northeast, Midwest, Mountain and California lines in the table. If Minnesota’s winter rate ran 16% below August, as its region’s did, its line would land nearer 3.3 (our arithmetic). Every field average we read sits below 3.55. In Ohio, New York and Michigan the line is about 5 or more, well beyond any rating-based figure above.
- Gas is cheap and winters are long. In the Ohio example the furnace you have costs $270 a year less to run, and a new one $376 less.
- Your electricity is expensive. Massachusetts and Maine pay more than 30¢ in the data here, which puts the line near 4 despite high gas prices.
- Backup strips would run often. At COP 3.0, a 20% backup share pulls the blended figure to 2.14.
- Your furnace is working and you’re keeping gas anyway. If the saving is a few dollars or a few tens of dollars a year, running the furnace until it needs replacing is a reasonable choice.
- The payback outlasts the equipment. See the section below. A federal-lab estimate puts the median life of a heat pump near 15 years, against more than 20 for a gas furnace.
One older measured comparison points the same way. In the New England study above, at that time’s prices ($0.18/kWh and $1.45/therm), gas at 85% efficiency came out 24% to 47% cheaper than the heat pump at the three sites compared, for the monitoring period only, in what the report calls a simplified analysis. The same table had the heat pump beating oil, propane and resistance heat, which is a different decision: for those fuels use our oil, propane and electric heat savings calculator.
When the heat pump costs less to run
- Your break-even COP is around 2.5 or lower. On these defaults that means parts of the Southeast and the Pacific Northwest, subject to the division warning above. The central-system averages in the British Columbia study clear that line. The New England ductless sites didn’t.
- You have a low winter or heat pump electricity rate. Enter it. At US average gas, COP 3.0 ties a new furnace at about 15.4¢. The calculator prints this rate for your numbers.
- You would close the gas account. A fixed charge of $20 a month (our example) adds $240 a year to the saving and turns the US example from −$98 to $142. That applies only if the water heater, range and anything else on gas go too, and those have costs of their own.
- Your AC is due at the same time. A heat pump replaces both, which changes the install math below more than the running math.
There is also a middle road. A heat pump can carry the mild days and a furnace the cold ones, switching near the temperature where the COP falls below your break-even. Our dual fuel switchover calculator finds that point, and the comparison in plain words is on our heat pump vs furnace page.
Install cost and payback
The extra-cost box takes your own figure: the heat pump quote minus what you would pay anyway. What you would pay anyway matters a great deal. Some of it depends on whether the AC is due too.
The one public study we found on this is California only. In a survey of 64 California contractors in December 2023, for a defined simple job (3 tons, no equipment moved, no panel upgrade, no ductwork replaced, code-minimum 14 SEER), the reported average extra cost of a heat pump was $583 over replacing both AC and furnace, $1,424 over replacing AC alone with the furnace kept as backup, and $8,958 over replacing a gas furnace alone. That last job adds a new 240V circuit, which reads to us as a home without central AC, so it would also buy cooling. These are contractor-reported figures, and the response rate was 6.9%. They were gathered before today’s refrigerant changes, so use them to see how the comparison works, not as a price for your job. Get your own number from written quotes for both jobs.
Quotes that look alike can leave out different work. Ask whether a panel upgrade or new circuit is included. Ask what happens to a gas water heater that shares the furnace’s flue: DOE’s 2023 furnace rule describes such a heater as “orphaned” when the furnace changes, and says the vent may need to be updated, resized or relined. DOE is writing about a furnace swap, and applying that to a furnace removal is our reasoning, so have a qualified person check it. Our page on what changes when the furnace goes covers this.
For lifespan, a 2011 Lawrence Berkeley estimate gives heat pumps a median of 14.6 years and a mean of 16.8, and gas furnaces 22.6 and 23.6. The heat pump figure rests on 2001 to 2007 housing survey data, and its authors say no single realistic curve easily fits the history, because the surveys showed the number of heat pumps barely changing from 1997 to 2003 while shipments grew. The same DOE furnace rule estimates a mean of 21.5 years for gas furnaces. These are stock averages, not how long your unit will last. They do mean a 12-year payback on a heat pump isn’t the same as a 12-year payback on something that lasts 22 years.
Don’t subtract a federal tax credit. 26 USC 25C(i) ended the credit for property placed in service after 31 December 2025. DOE’s Program Notice 26-2 covers the federal rebate, now called HEEHR, and says two things. It removes “upgrades for fuel-switching (i.e. replacement of non-electric appliances)”, and it allows “dwellings to retain existing fossil-fuel HVAC systems when installing a heat pump, even if the heat pump will not become the primary source of heating and cooling.” DOE’s text doesn’t settle what a gas home that keeps its furnace can get, so ask your state energy office. State and utility rebates vary and many change on 31 December. See our rebates and rules for what we have read, and enter only money a program has confirmed in writing.
If you’re weighing a non-condensing furnace, note that the DOE rule linked above sets a 95% AFUE minimum for most gas furnaces made or imported from 18 December 2028. Gas trade groups have petitioned DOE to move that date to at least 1 January 2030. DOE took comments until 27 May 2026, and we found no decision as of 4 November. On 8 June 2026 the Supreme Court vacated the appeals court judgment that had upheld the rule and sent the case back. We found no change to the rule or the date.
What the calculator leaves out
- Cooling. It compares heating only unless you fill in the cooling box.
- Furnace blower power. A furnace’s fan runs on electricity and that isn’t counted, which tilts the result toward the furnace.
- Duct losses. Both options are assumed to use the same ducts, so losses cancel. A ductless system would change that.
- Comfort, maintenance, repairs and emissions. None of these is in the numbers.
- Sizing. This tool doesn’t size anything or replace a load calculation. A qualified installer does that.
- Time-of-use and tiered rates. One rate is applied to every kWh, so a heat pump that pushes you into a higher tier can cost more than shown.
This page is general information, not professional, tax or legal advice. Results are estimates. A qualified installer, the program or a tax professional decides what applies to your home.
Sources checked on 4 November 2026.
Formulas and sources
- Census division of the chosen state: Arithmetic on the reader's own entries, no outside figure
- State electricity rate, $/kWh: EIA Electric Power Monthly, Table 5.6.a, August 2026 (released 23 October 2026)
- Electricity rate used, $/kWh: Arithmetic on the reader's own entries, no outside figure
- Division winter gas price, $/Mcf: EIA Short-Term Energy Outlook, October 2026, Table 5b: residential natural gas prices, Q1 2026
- Gas price used, $ per million Btu of gas: EIA: British thermal units (Btu)
- Gas price used, per bill unit: Arithmetic on the reader's own entries, no outside figure
- Gas burned for heating, million Btu: EIA: British thermal units (Btu)
- Heat delivered, million Btu: Arithmetic on the reader's own entries, no outside figure
- Furnace you have, yearly heating cost: Arithmetic on the reader's own entries, no outside figure
- New furnace, yearly heating cost: Arithmetic on the reader's own entries, no outside figure
- Seasonal COP including backup: Arithmetic on the reader's own entries, no outside figure
- Heat pump electricity use, kWh: EIA: British thermal units (Btu)
- Heat pump, yearly heating cost: Arithmetic on the reader's own entries, no outside figure
- Fixed gas charge and cooling change, a year: Arithmetic on the reader's own entries, no outside figure
- Saving vs the furnace you have: Arithmetic on the reader's own entries, no outside figure
- Saving vs a new furnace: Arithmetic on the reader's own entries, no outside figure
- Electric resistance heat, $ per million Btu: EIA: British thermal units (Btu)
- Break-even COP vs the furnace you have: Arithmetic on the reader's own entries, no outside figure
- Break-even COP vs a new furnace: Arithmetic on the reader's own entries, no outside figure
- Break-even electricity rate vs a new furnace: Arithmetic on the reader's own entries, no outside figure
- Simple payback of the extra cost, years: Arithmetic on the reader's own entries, no outside figure
- New England: residential gas, Q1 2026 ($/Mcf) (22.88, as of 2026-10-06): EIA Short-Term Energy Outlook, October 2026, Table 5b: residential natural gas prices, Q1 2026
- Middle Atlantic: residential gas, Q1 2026 ($/Mcf) (15.57, as of 2026-10-06): EIA Short-Term Energy Outlook, October 2026, Table 5b: residential natural gas prices, Q1 2026
- East North Central: residential gas, Q1 2026 ($/Mcf) (11.21, as of 2026-10-06): EIA Short-Term Energy Outlook, October 2026, Table 5b: residential natural gas prices, Q1 2026
- West North Central: residential gas, Q1 2026 ($/Mcf) (12.46, as of 2026-10-06): EIA Short-Term Energy Outlook, October 2026, Table 5b: residential natural gas prices, Q1 2026
- South Atlantic: residential gas, Q1 2026 ($/Mcf) (17.06, as of 2026-10-06): EIA Short-Term Energy Outlook, October 2026, Table 5b: residential natural gas prices, Q1 2026
- East South Central: residential gas, Q1 2026 ($/Mcf) (13.96, as of 2026-10-06): EIA Short-Term Energy Outlook, October 2026, Table 5b: residential natural gas prices, Q1 2026
- West South Central: residential gas, Q1 2026 ($/Mcf) (17.51, as of 2026-10-06): EIA Short-Term Energy Outlook, October 2026, Table 5b: residential natural gas prices, Q1 2026
- Mountain: residential gas, Q1 2026 ($/Mcf) (10.86, as of 2026-10-06): EIA Short-Term Energy Outlook, October 2026, Table 5b: residential natural gas prices, Q1 2026
- Pacific: residential gas, Q1 2026 ($/Mcf) (20.34, as of 2026-10-06): EIA Short-Term Energy Outlook, October 2026, Table 5b: residential natural gas prices, Q1 2026
- United States: residential gas, Q1 2026 ($/Mcf) (14.77, as of 2026-10-06): EIA Short-Term Energy Outlook, October 2026, Table 5b: residential natural gas prices, Q1 2026
- Btu per kWh (3412, as of 2026-11-04): EIA: British thermal units (Btu)
- Million Btu per Mcf of natural gas (1.036, as of 2026-11-04): EIA: British thermal units (Btu)
Sources
- EIA Short-Term Energy Outlook, October 2026, Tables 5b and 7c: regional residential gas and electricity prices
- EIA Electric Power Monthly, Table 5.6.a, August 2026 (released 23 October 2026)
- EIA Natural Gas Prices: monthly US residential price (released 30 October 2026)
- EIA: British thermal units (Btu)
- EIA RECS 2020, Table CE5.4.ST: space heating site energy by state
- 10 CFR 430.32: energy conservation standards, heat pumps (Cornell LII)
- RDH Building Science: BC Cold Climate Heat Pump Study, Final Report (November 2020)
- CARB, DOE Building America: Field Performance of Inverter-Driven Heat Pumps in Cold Climates (August 2015)
- Efficiency Maine: heat pump rebate brochure (costs as of 11 September 2026)
- TECH Clean California Incremental Cost Study, Phase I Findings (February 2024)
- LBNL, Lutz et al.: residential furnace, heat pump and AC lifetimes (October 2011)
- DOE consumer furnace energy conservation standards, final rule, 88 FR 87502 (18 December 2023)
- DOE notification of petition on furnace compliance dates, Federal Register, 27 April 2026
- 26 U.S.C. 25C (Cornell LII)
- DOE Program Notice 26-2: HEEHR Program for States and Territories
- US Supreme Court: Order list, 8 June 2026, No. 25-879