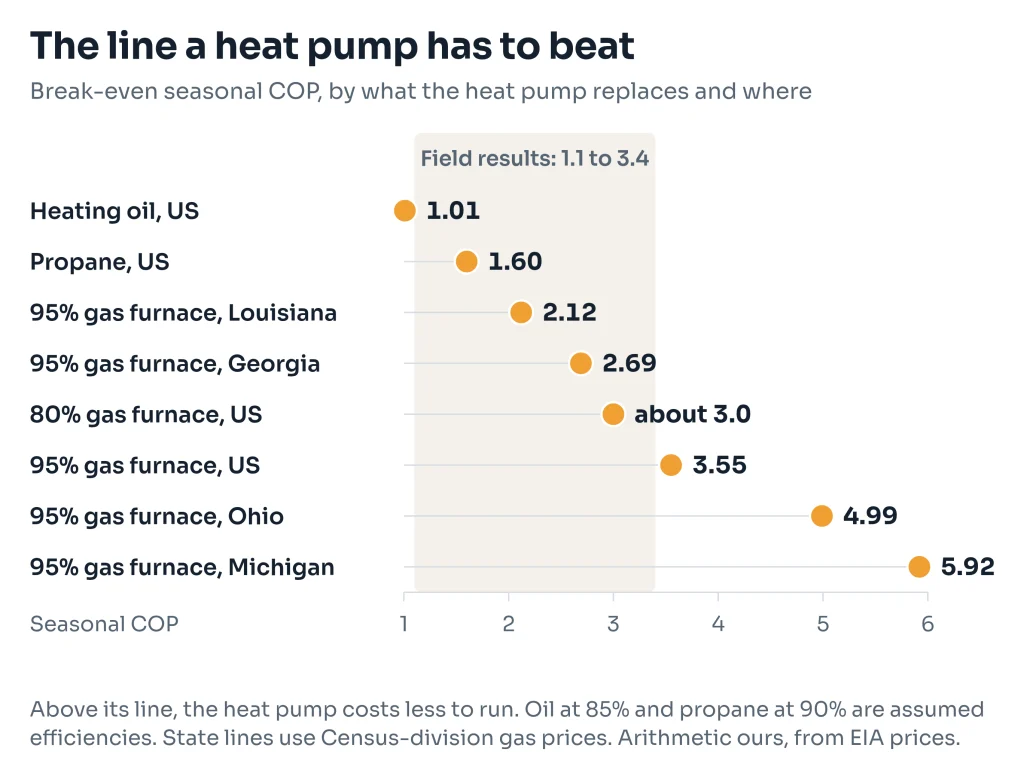
On running cost alone, at US average prices, a new 95% gas furnace costs less than a heat pump unless the heat pump averages a seasonal COP above about 3.5. That is higher than every seasonal field average we have read. Against an 80% furnace the line drops to about 3.0, and against propane (about 1.6) or heating oil (about 1.0) the heat pump usually wins. Your state moves the gas lines a long way, and the exact figure depends on whose gas price you use: about 2.1 in Louisiana, 2.7 to 2.9 in Georgia, 4.6 to 5.0 in Ohio and 5.9 to 6.2 in Michigan.
That is heat only. A heat pump also replaces your central air, so the winner also depends on which equipment is failing and what your house can take. This page is the long version of our furnace or heat pump guide: the math, a table for every state but Alaska and Hawaii, and plain lists of when each one is the better call. To run your own bills, use the heat pump vs gas furnace calculator. The Last Furnace sells and installs nothing, and in plenty of houses the honest answer is that the furnace stays.
The number that decides it
A furnace and a heat pump both sell you heat, so compare the price of the same heat. Here is one million Btu delivered into the house at US average prices.
| Heat source | Price and efficiency used | Cost per million Btu delivered |
|---|---|---|
| Gas furnace, 95% | $14.77/Mcf | $15.01 |
| Heat pump, COP 3 | 18.16¢/kWh | $17.74 |
| Gas furnace, 80% | $14.77/Mcf | $17.82 |
| Heat pump, COP 2.5 | 18.16¢/kWh | $21.29 |
| Propane furnace, 90% | $2.73/gal, excluding tax | $33.17 |
| Heating oil furnace, 85% | $6.233/gal, excluding tax | $52.95 |
| Electric furnace or emergency heat, COP 1 | 18.16¢/kWh | $53.22 |
The arithmetic is ours and the furnace efficiencies and COPs are our assumption, chosen as examples. Prices: residential electricity for August 2026, preliminary (EIA Electric Power Monthly); residential gas for the first quarter of 2026 (EIA Short-Term Energy Outlook, October 2026, Table 5b); heating oil and propane from EIA’s weekly survey of 26 October 2026, before tax. Conversions are EIA’s Btu factors: 3,412 Btu per kWh, 1,036 per cubic foot of gas, 138,500 per gallon of oil, 91,452 per gallon of propane.
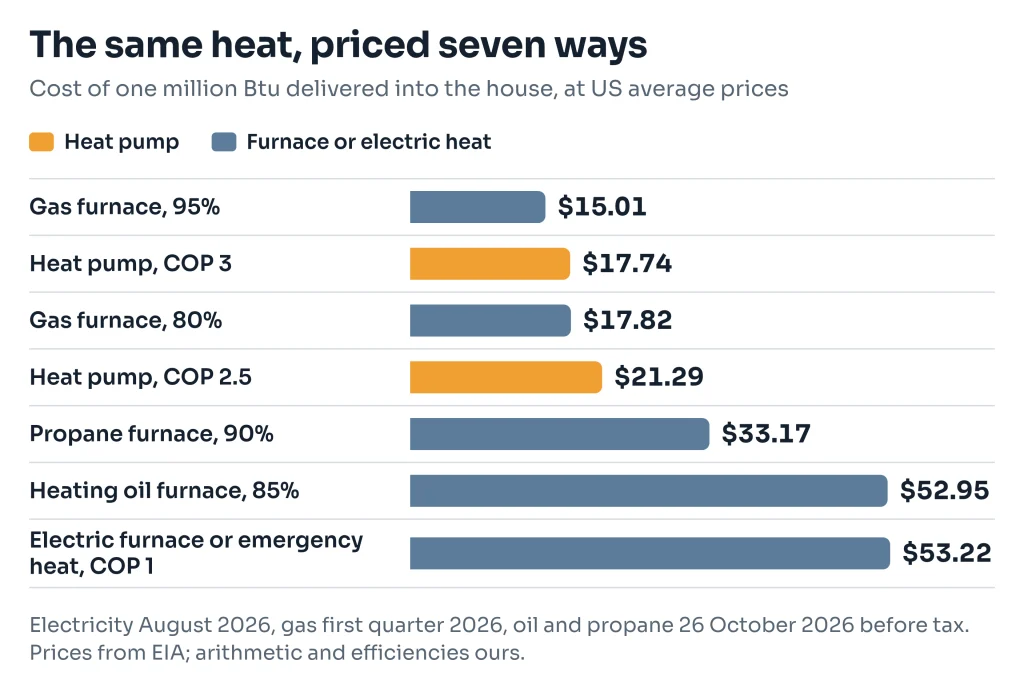
COP means units of heat delivered per unit of electricity used. COP 1 is an electric heater; COP 3 is three units of heat for one of power. That gives a single number for any comparison, the break-even COP: the cost of electric-resistance heat divided by the cost of the fuel’s delivered heat. For the 95% furnace above, $53.22 ÷ $15.01 = 3.55. If your heat pump averages more than that over a winter, it costs less to run. If it averages less, the furnace does.
Why we don’t use the latest gas price
EIA’s monthly US residential gas price was $27.05 per Mcf in August 2026, nearly double the $14.77 of the first quarter. That price is everything customers paid, delivery and other charges included, divided by the gas they used, and in summer homes use very little. Put the August figure in the table and a 95% furnace appears to cost $27.48 per million Btu, so a COP 3 heat pump looks like the clear winner. Use the winter price, when furnaces actually run, and it loses. Any comparison built on the latest month can hand you the wrong answer in late summer and fall.
Our electricity figure is a summer month too. Nationally it barely matters: EIA has the US residential price at 17.83¢ in the first quarter of 2026 against 18.16¢ in August. We haven’t measured the gap state by state, and some utilities price winter or heat pump use differently, so your own bill beats our table.
What a heat pump really delivers
So the question becomes what seasonal COP you’d get. Nobody can promise that figure, and a rating is not a measurement of your house. An HSPF2 rating divided by 3.412 gives a seasonal COP for that rating test (our arithmetic). Field studies measure real homes, usually lower and with wide spreads.
| Figure | Seasonal COP | What it is |
|---|---|---|
| Federal minimum, split heat pump, 7.5 HSPF2 | 2.20 | Rating. Applies nationwide |
| ENERGY STAR cold climate minimum, ducted, 8.1 HSPF2 | 2.37 | Rating |
| Carrier 27VNA1, up to 12.5 HSPF2 | 3.66 | Maker’s claim for its best match. One example, not a pick |
| British Columbia study, ductless | 2.4 | Measured estimate, average, 2019-20, 24 occupied homes in all, climate zones 4 and 5. Single systems ran from 1.6 to 3.4 |
| Same study, central single-stage | 2.6 | Measured estimate, average with backup heat counted. Single homes ran from 1.4 to 3.4 |
| Same study, central variable-speed | 3.3 | Measured estimate, average of two homes, one of them a hybrid with a ductless unit, with backup heat counted. Most central systems there cut back or stopped between 3°C and -5°C (about 37°F to 23°F) and leaned on backup heat, so this is not a whole-winter figure for a cold place |
| Building America study, ductless, CT, MA, VT | 1.1 to 2.3 | Measured at seven sites over 28 to 204 days, winter and spring 2013-14, about ±21%. Mostly supplemental heat. The authors say results are not comparable to ratings |
The field figures are older machines in particular homes, and none is a US average. They tell you two things. Spread between homes is wide, because airflow, controls and how the unit is run all matter. And to beat a 95% furnace at US average prices, a system needs to hold 3.55, which as a rating is about 12.1 HSPF2. Of the maker sheets we read, only the Carrier claim clears that on paper, before any real-world losses.
Which wins in your state
The table gives the break-even COP for each state, so you can see where your line sits. Electricity is EIA’s August 2026 state price, from the Electric Power Monthly table linked above. The first gas column is EIA’s first-quarter 2026 price for the state’s Census division, from the same outlook table as above and the last full winter quarter in it. That outlook has no state figures, so the last two columns redo the sum with the state’s own gas price: our average of EIA’s monthly state prices for January to March 2026, from the monthly price page linked above, weighted by EIA’s residential gas deliveries. The state column is the closer guide, and the bands below use it. All of it is our arithmetic. Read the bands this way:
- Under 3 against a 95% furnace (13 states). Much of the South, plus Arizona, Washington and Oregon. A well-installed efficient heat pump has a real chance of costing less to run than even a new furnace.
- 3 to 4 (14 states). Close. A new 95% furnace usually keeps the edge. An old 80% furnace may not, since these states’ 80% lines run from about 2.5 to 3.3 (multiply the state figure by 0.84).
- Above 4 (22 including DC). Most of the Midwest and Northeast and much of the Rockies. The line sits above the best rating in our table, and even the 80% line sits above every field average we read. At these prices, expect the furnace to cost less to run.
| State | Electricity ¢/kWh | Division gas $/Mcf, Q1 | Break-even COP v 95% furnace, division gas | Break-even COP v 80% furnace, division gas | State gas $/Mcf, Q1 | Break-even COP v 95% furnace, state gas |
|---|---|---|---|---|---|---|
| Alabama | 16.33 | 13.96 | 3.37 | 2.84 | 16.57 | 2.84 |
| Arizona | 15.05 | 10.86 | 4.00 | 3.37 | 17.96 | 2.42 |
| Arkansas | 14.37 | 17.51 | 2.37 | 1.99 | 20.37 | 2.04 |
| California | 29.75 | 20.34 | 4.22 | 3.55 | 22.27 | 3.85 |
| Colorado | 17.17 | 10.86 | 4.56 | 3.84 | 10.95 | 4.52 |
| Connecticut | 24.51 | 22.88 | 3.09 | 2.60 | 18.16 | 3.89 |
| Delaware | 18.70 | 17.06 | 3.16 | 2.66 | 16.37 | 3.30 |
| District of Columbia | 25.98 | 17.06 | 4.39 | 3.70 | 16.42 | 4.56 |
| Florida | 14.99 | 17.06 | 2.53 | 2.13 | No Q1 data | No Q1 data |
| Georgia | 15.90 | 17.06 | 2.69 | 2.26 | 15.82 | 2.90 |
| Idaho | 13.37 | 10.86 | 3.55 | 2.99 | 7.10 | 5.43 |
| Illinois | 19.32 | 11.21 | 4.97 | 4.19 | 10.74 | 5.19 |
| Indiana | 17.02 | 11.21 | 4.38 | 3.69 | 10.90 | 4.50 |
| Iowa | 17.06 | 12.46 | 3.95 | 3.33 | 11.16 | 4.41 |
| Kansas | 15.47 | 12.46 | 3.58 | 3.02 | 13.75 | 3.24 |
| Kentucky | 13.80 | 13.96 | 2.85 | 2.40 | 14.38 | 2.77 |
| Louisiana | 12.87 | 17.51 | 2.12 | 1.79 | 17.82* | 2.08* |
| Maine | 32.11 | 22.88 | 4.05 | 3.41 | 17.87* | 5.18* |
| Maryland | 21.40 | 17.06 | 3.62 | 3.05 | 16.38* | 3.77* |
| Massachusetts | 30.48 | 22.88 | 3.84 | 3.24 | 26.21 | 3.35 |
| Michigan | 22.99 | 11.21 | 5.92 | 4.98 | 10.68 | 6.21 |
| Minnesota | 17.20 | 12.46 | 3.98 | 3.35 | 12.01 | 4.13 |
| Mississippi | 14.43 | 13.96 | 2.98 | 2.51 | 14.29 | 2.91 |
| Missouri | 16.02 | 12.46 | 3.71 | 3.12 | 14.66 | 3.15 |
| Montana | 15.57 | 10.86 | 4.14 | 3.48 | 8.59 | 5.23 |
| Nebraska | 13.54 | 12.46 | 3.13 | 2.64 | 10.90 | 3.58 |
| Nevada | 12.72 | 10.86 | 3.38 | 2.85 | 9.47 | 3.87 |
| New Hampshire | 27.64 | 22.88 | 3.48 | 2.93 | 19.52 | 4.08 |
| New Jersey | 24.61 | 15.57 | 4.56 | 3.84 | 14.10 | 5.03 |
| New Mexico | 16.51 | 10.86 | 4.39 | 3.69 | 10.64* | 4.48* |
| New York | 28.65 | 15.57 | 5.31 | 4.47 | 16.86 | 4.90 |
| North Carolina | 14.95 | 17.06 | 2.53 | 2.13 | 17.75* | 2.43* |
| North Dakota | 13.31 | 12.46 | 3.08 | 2.59 | 8.64 | 4.44 |
| Ohio | 19.38 | 11.21 | 4.99 | 4.20 | 12.23 | 4.57 |
| Oklahoma | 14.82 | 17.51 | 2.44 | 2.06 | 12.42 | 3.44 |
| Oregon | 15.92 | 20.34 | 2.26 | 1.90 | 15.71 | 2.92 |
| Pennsylvania | 21.77 | 15.57 | 4.03 | 3.40 | 14.81 | 4.24 |
| Rhode Island | 28.18 | 22.88 | 3.55 | 2.99 | 18.31 | 4.44 |
| South Carolina | 15.76 | 17.06 | 2.66 | 2.24 | 16.96* | 2.68* |
| South Dakota | 15.15 | 12.46 | 3.51 | 2.95 | 10.49 | 4.17 |
| Tennessee | 13.42 | 13.96 | 2.77 | 2.34 | 12.52 | 3.09 |
| Texas | 15.91 | 17.51 | 2.62 | 2.21 | 18.66 | 2.46 |
| Utah | 13.31 | 10.86 | 3.54 | 2.98 | 11.07 | 3.47 |
| Vermont | 23.84 | 22.88 | 3.01 | 2.53 | 16.20 | 4.24 |
| Virginia | 17.64 | 17.06 | 2.98 | 2.51 | 16.90 | 3.01 |
| Washington | 14.63 | 20.34 | 2.07 | 1.75 | 17.35* | 2.43* |
| West Virginia | 16.31 | 17.06 | 2.76 | 2.32 | 13.21 | 3.56 |
| Wisconsin | 19.41 | 11.21 | 4.99 | 4.21 | 11.86 | 4.72 |
| Wyoming | 14.43 | 10.86 | 3.83 | 3.23 | 10.31 | 4.04 |
Above the break-even COP, the heat pump costs less to run. Below it, the gas furnace does. Treat these as a starting point:
- A division gas price blends several states. Washington and Oregon share a figure with California, and Florida shares one with states as far north as Delaware. It misleads most in places like Arizona (4.00 on the division price, 2.42 on its own), Idaho (3.55 and 5.43), Oklahoma (2.44 and 3.44) and Vermont (3.01 and 4.24). Our calculator starts from the division price, so enter your own. Alaska and Hawaii are left out because the division figure doesn’t describe them.
- EIA doesn’t publish every state every month. An asterisk marks a state with only one or two of the three months, and Louisiana and Maine have one. Florida has none, so it stays in the under-3 band on its division figure alone. EIA also withholds some delivery figures, so Oklahoma and New Mexico are plain averages of their published months, not weighted ones. Treat those lines as rough.
- One power price can move a line a lot. Efficiency Maine’s brochure assumes 26¢/kWh, as of 11 September 2026, against EIA’s 32.11¢ for August. At 26¢, Maine’s division-price line against a 95% furnace falls from 4.05 to 3.28.
- These are average prices, fixed charges included. If you would keep gas for a stove or water heater, the fixed gas charge stays on your bill and the gas you stop buying is worth less than the average. If you drop gas entirely, that charge goes too. Your bill’s per-therm and per-kWh lines settle it.
Six example homes
Dollars are easier to weigh than ratios. Each home below burns the 2020 EIA RECS average of gas for heating in its state. The existing 80% furnace is our assumption. The table shows the yearly cost of delivering that same heat each way, at the US or division gas prices above, rounded to $10.
| Home | Gas burned now, MMBtu | Heat needed, MMBtu | Old 80% furnace | New 95% furnace | Heat pump COP 2.5 | Heat pump COP 3 | Heat pump COP 3.5 |
|---|---|---|---|---|---|---|---|
| Georgia | 36.96 | 29.6 | $610 | $510 | $550 | $460 | $390 |
| Colorado | 52.59 | 42.1 | $550 | $460 | $850 | $710 | $600 |
| Massachusetts | 48.86 | 39.1 | $1,080 | $910 | $1,400 | $1,160 | $1,000 |
| Minnesota | 64.11 | 51.3 | $770 | $650 | $1,030 | $860 | $740 |
| Ohio | 62.26 | 49.8 | $670 | $570 | $1,130 | $940 | $810 |
| US average | 44.90 | 35.9 | $640 | $540 | $760 | $640 | $550 |
In Georgia, a heat pump at COP 3 costs about $50 a year less than a new 95% furnace. In Ohio it costs about $370 more, and more than the old furnace it replaced. Massachusetts has very expensive gas and it still takes COP 3.84 to match the new furnace, because its power is expensive too. On each state’s own gas price those gaps shift: about $20 in Georgia, about $320 in Ohio, and a Massachusetts line of 3.35, so COP 3.5 there would beat the new furnace at about $1,040. COP 3.5 is shown for the math; it’s above every seasonal field average we read. The table leaves out fixed charges and backup electric heat, and backup would raise the heat pump columns in a cold place. Cooling is out too, because a heat pump and a central AC of equal SEER2 cost about the same to run. Each row uses one survey year’s average, not your house.
Propane, oil and electric furnaces
If your furnace doesn’t burn natural gas, the picture changes. These lines assume an 85% oil furnace and a 90% propane furnace (our assumption) at the 26 October 2026 EIA prices, before tax, with state August power prices (our arithmetic).
| Place | Oil $/gal | Break-even COP v oil | Propane $/gal | Break-even COP v propane |
|---|---|---|---|---|
| US | 6.233 | 1.01 | 2.730 | 1.60 |
| Maine | 6.040 | 1.83 | 3.679 | 2.11 |
| Massachusetts | 6.254 | 1.68 | 3.717 | 1.98 |
| Michigan | 6.193 | 1.28 | 2.458 | 2.26 |
| Minnesota | 5.948 | 1.00 | 2.050 | 2.02 |
| New York | 6.441 | 1.53 | 3.794 | 1.82 |
| Pennsylvania | 6.048 | 1.24 | 3.209 | 1.64 |
Oil is the clearest case this winter. In its October 2026 outlook, EIA expects oil-heated homes to spend 21% more than last winter, on prices up more than 30%. Propane is less automatic: Upper Midwest propane is cheap enough that the line sits above 2, which some of the field results above missed. These are October prices and propane usually runs below its winter peak, so use the price you paid last January.
Electric furnaces are the simplest case. They run at COP 1, so a heat pump working normally beats them for most of the winter. DOE says today’s heat pump can cut electricity use for heating by about 65% against electric resistance. For these homes use the savings calculator for oil, propane and electric heat.
What changes when it gets cold
A gas furnace puts out the same heat at 30°F and at -10°F. A heat pump loses capacity as it gets colder, just as the house needs more. Two maker sheets show how far apart heat pumps can be:
- Ordinary ducted unit. Rheem’s 3-ton WP14AY36 lists 33,600 Btu/h at COP 3.4 at 47°F and 22,200 Btu/h at COP 2.5 at 17°F. That is 66% of the capacity, 30 degrees down. The sheet has no 5°F point.
- Cold-climate ducted unit. The Carrier 27VNA1 sheet linked in the table above lists, for size 54 in comfort mode with 70°F indoor air, 64,000 Btu/h at 47°F, 50,500 at 17°F and 45,000 at -3°F at maximum demand, net of defrost. From the sheet’s system power, that is COP 4.24, 2.95 and 2.11 (our arithmetic). The maker gives -23°F as its lowest operating temperature, which is not the same as keeping a house warm at -23°F.
Where the heat pump’s output crosses the house’s heat loss is the balance point. Below it, something else has to help, usually electric strips at COP 1, at about $53 per million Btu at US prices. How often that happens depends on your design temperature. ENERGY STAR’s county limit table (99% heating values, 2015 edition; it’s a limit table, not an ideal design value, and takes the lowest station in a county) lists 25°F for Atlanta’s Fulton County, 9°F for Columbus’s Franklin County, -8°F for Minneapolis’s Hennepin County and -17°F for Aroostook County, Maine. Ask an installer for the value at your address.
This is one reason heat pumps cluster in warmer regions. In EIA’s 2020 survey, a central heat pump was the main heat in 28% of hot-humid homes and 19% of mixed-humid homes, against 3% in the cold and very-cold regions (our shares of EIA’s counts; mini splits are counted separately). Ask for the capacity at your design temperature, not only the rating.
When a furnace is the better call
- Your gas is cheap against your power. A break-even COP above about 4 is beyond every rating and field figure in our table. On state gas prices that’s 6.21 in Michigan, 5.43 in Idaho, 5.19 in Illinois, 5.03 in New Jersey, 4.90 in New York, 4.57 in Ohio and 4.52 in Colorado. The example Ohio home above pays about $370 more a year at COP 3 than with a new 95% furnace, or about $320 on Ohio’s own gas price.
- Only the furnace has failed and your central AC is young. In the California contractor survey below, a heat pump averaged $8,958 more than a like-for-like furnace, and part of that buys cooling you already own.
- Your design temperature is very low and you have no backup plan. Below the balance point, electric strips run at COP 1. A furnace needs no second system.
- Your ducts or electrical service would need major work. A heat pump may need more airflow than your ducts carry and new circuits for backup heat. The survey below assumed no duct replacement and no panel upgrade.
- Your house loses power in storms. A furnace needs electricity for its blower and controls, but far less than a heat pump. Carrier’s 59SC5B furnace sheet lists at most 12.9 amps at 115 volts, about 1.5 kW (our arithmetic). The Carrier heat pump above draws about 6 kW at maximum demand in deep cold, before any strips.

If you are choosing a furnace, efficiency is a real decision. Moving the example Ohio home from 80% to 95% saves about $100 a year on these prices. A condensing furnace can need new venting and a drain, and DOE’s 2023 rule sets a 95% AFUE minimum for non-weatherized and mobile home gas furnaces made or imported from 18 December 2028. That date isn’t settled: gas trade groups asked DOE to move it to at least 1 January 2030, DOE took comments through May 2026, and we found no decision. On 8 June 2026 the Supreme Court vacated the appeals court judgment that had upheld the rule and sent the case back. We found no change to the rule or the date as of 4 November 2026.
When a heat pump is the better call
- You heat with oil, propane or electric resistance. Those lines run from about 1 to 2.3. Every seasonal average in the table above clears them, though the weakest Building America sites fell short of the higher lines.
- You live where the line is under 3. On state gas prices that includes Arkansas 2.04, Arizona 2.42, Texas 2.46, Georgia 2.90 and Oregon 2.92, most with mild winters that help the COP.
- Your AC and furnace are both near the end. Then you are buying one system instead of two, and the California survey below averages the extra at $583.
- Your AC has failed and your furnace is fine. A heat pump can take the AC’s place and keep the furnace as backup, for an average extra $1,424 in the same California survey.
- You have no gas line. Then the cheap-gas comparison never applied.
- You would drop gas altogether. Removing the fixed charge can tip a close call, but only if every gas appliance goes.
Keeping both: dual fuel
A heat pump with a gas furnace behind it avoids the choice. The heat pump runs while it costs less, and the furnace takes over below a set temperature. The switch point comes from the same break-even number. On the Carrier sheet above, in comfort mode at maximum demand, COP falls from 4.24 at 47°F to 3.73 at 37°F, 3.29 at 27°F, 2.95 at 17°F and 2.44 at 7°F (our arithmetic). So at US average prices and a 95% furnace (3.55), the heat pump costs less down to somewhere between 37°F and 27°F. In Georgia (2.69), it’s between 17°F and 7°F. In Ohio (4.99), the furnace costs less at every point from 47°F down at that demand level. Those are division-price lines; the state-price lines for Georgia (2.90) and Ohio (4.57) land in the same gaps. They are also full-output numbers. Part-load COP can run higher: the same sheet works out to 3.33 at 17°F at median demand, against 2.95. The sheet’s efficiency mode gives a less even curve at maximum demand: 3.52 at 47°F, 3.71 at 37°F and 3.36 at 17°F (our arithmetic). Ask which mode your system will be set up in.
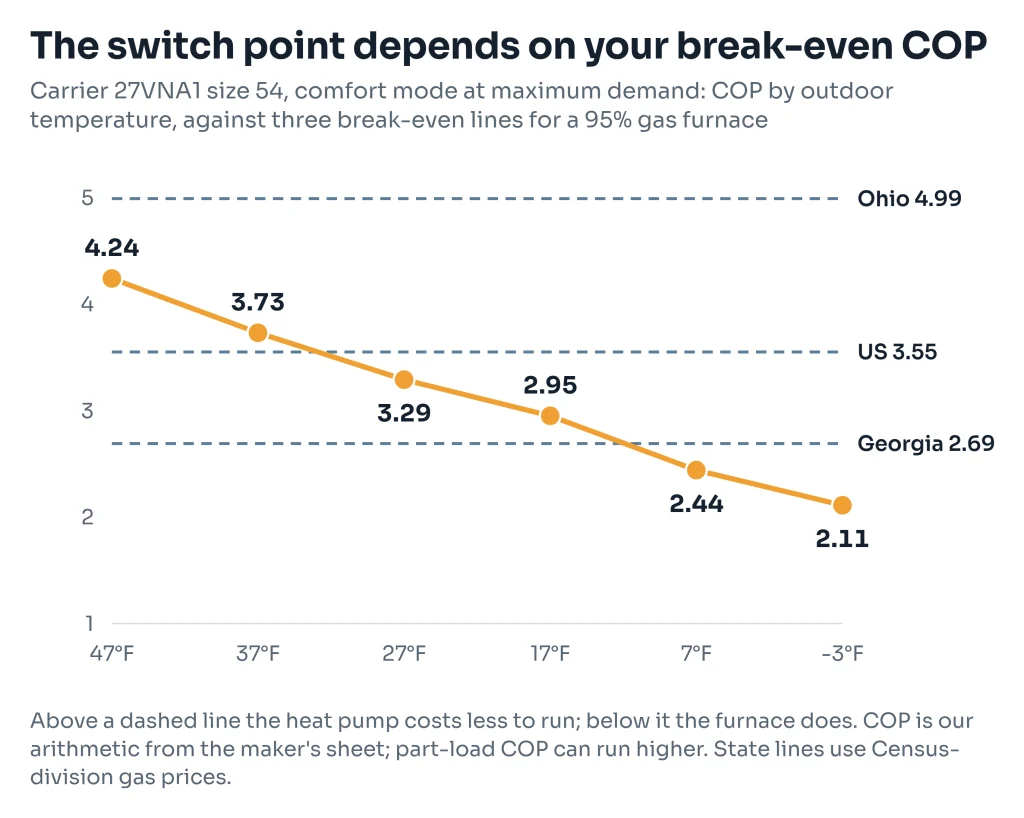
Balance point and switch point are different things: one is about capacity and the other is about price. Run yours in the dual fuel switchover calculator. Check the rebates first too, as some programs exclude this setup.
Install cost and lifespan
The extra cost depends on what you would otherwise buy. The best public figure we have found is TECH Clean California’s cost study: an online survey of 64 registered contractors in December 2023, with average answers for a defined simple 3-ton job. It assumed code-minimum 14 SEER heat pumps, no equipment moved, no panel upgrade and no ducts replaced. These are reported averages, not invoices, and they cover California’s Hot-Dry and Marine regions only, in 2023.
| A heat pump instead of replacing… | Average extra cost |
|---|---|
| Central AC and gas furnace | $583 |
| Central AC only | $1,424 |
| Gas furnace only | $8,958 |
The gap between those lines is the point: the same heat pump looks cheap or expensive depending on what it replaces. For a sticker price, Carrier’s published estimate is $6,000 to $25,000 installed in 2026 (dated 15 September 2026, maker’s estimate, no method given), a range too wide to plan on. Your installer’s written price for your house is the figure that counts.
Heat pumps run in both seasons and appear to wear out sooner. Lawrence Berkeley National Laboratory’s 2011 study, built on federal housing surveys through 2007, estimated a median life of 14.6 years for heat pumps, 18.0 for central AC and 22.6 for gas furnaces, and its authors note that the surveys disagreed on heat pumps. DOE’s 2023 furnace rule, linked above, uses a mean of 21.5 years for gas furnaces. Those describe old stock, not your unit. Over 30 years, they suggest more replacements on the heat pump side, though the furnace side has an AC to replace as well.
Comfort, ducts and power
The air feels different. Furnaces generally deliver air at 130°F to 140°F, and heat pumps at about 80°F to 115°F, according to a 2011 federal lab guide, so more air has to move to bring the same warmth. People who like a blast of hot air at the register may not like that. Others like the steadier, longer run. Neither is wrong.
The airflow matters for more than comfort. CEE’s Duct Retrofit Decision Guide for heat pump installers, hosted on a DOE site, says heat pumps may need more airflow than the existing system and that ducts should be evaluated and tested before reuse. Electrically, a heat pump and any backup strips need circuits sized to the maker’s MCA and MOCP figures, set by a licensed electrician. Ask early, since a panel upgrade can change the budget.
Rebates and credits have changed
Many pages still promise money that’s gone. The federal 25C credit does not apply to property placed in service after 31 December 2025. The federal HEAR rebate, now HEEHR, changed on 29 May 2026: Program Notice 26-2 removes “upgrades for fuel-switching (i.e. replacement of non-electric appliances)”, keeps electric-to-electric upgrades, and also allows “dwellings to retain existing fossil-fuel HVAC systems when installing a heat pump, even if the heat pump will not become the primary source of heating and cooling.” DOE’s text doesn’t settle how those two lines fit together for a gas home that keeps its furnace, so ask your state energy office.
State and utility money now matters more, and it can swing the choice. Mass Save’s 2026 sheet lists whole-home rebates of $2,650 a ton up to $8,500 and puts natural gas among the eligible fuels, though homes with existing gas heat can’t get the income-qualified amounts. Its 2026 form covers installs through 31 December 2026. Mass Save’s page says the whole-home rebate falls to $2,350 a ton, capped at $7,500, for projects installed on or after 1 January 2027, so check before you sign. Efficiency Maine’s ducted rebate page says “Dual fuel systems are not rebate eligible” and requires that a home had no natural gas account before the upgrade. Both programs set their own conditions and dates, and the program decides. See our rebates and rules guide for what we have read state by state.
Emissions and safety
Carbon is a separate question from cost, and the heat pump does well on it at US averages. Delivering one million Btu from gas at 95% emits about 123 pounds of CO2 from the flue (EIA’s 116.65 lb per million Btu). A heat pump at COP 3 on the 2023 US grid average of 0.81 lb per kWh is about 79 pounds, and at COP 2 about 119 (our arithmetic). Grids vary widely by state, so that gap isn’t the same everywhere, and these figures leave out leaks and upstream emissions.
A furnace burns fuel in your house. EPA lists back-drafting from furnaces and gas water heaters as a carbon monoxide source and says to have a trained professional inspect, clean and tune the central heating system, flues and chimneys every year. CPSC says to put CO alarms on every level and outside sleeping areas. Keep them if any fuel-burning appliance stays. If an alarm sounds, get outside, then call 911.
Moving to a condensing furnace, or removing a furnace, can leave a gas water heater alone on a flue that was sized for two. DOE’s 2023 furnace rule, linked above, calls that an orphaned water heater when describing a switch to a condensing furnace, and the fix can mean new vent connectors, vent resizing or chimney relining. Taking the furnace out entirely leaves it in the same position, by our reasoning. Either way, have a qualified person check it. Our guide to what changes when the furnace goes covers this, frozen pipes and backup heat.
Work out your own answer
You can get your own line in five minutes with a winter gas bill and any electric bill.
- Find your gas price per therm. Add the supply and delivery charges per therm on a January or February bill. If it bills in Ccf, divide the price by about 1.036 for a therm price, or use the factor on your bill.
- Find your electricity price per kWh the same way, from a winter bill if you can.
- Do the sum. Break-even COP = electricity price × 29.3 × furnace efficiency ÷ gas price per therm.
- Ask what seasonal COP is realistic. Divide the quoted model’s HSPF2 by 3.412. That is a rating, not what your home will get: the single homes in the field table above ran from 1.1 to 3.4. Then ask for the maker’s capacity and COP at your design temperature.
- Compare. Allow for a real home running below its rating. If the COP you expect is still well above your line, the heat pump should cost less to run. If it’s well below, the furnace should. If it’s close, install cost, what’s failing and rebates decide.
Example at US prices: $0.1816 × 29.3 × 0.95 ÷ $1.43 per therm = about 3.5. For the full version, with your yearly gas use and a payback line, use the calculator linked at the top of this page.
Before you sign for either system, get these from the installer in writing:
- A room-by-room heat load calculation for your house, not a size taken from the old unit. ACCA Manual J is the usual standard.
- For a heat pump: the maker’s capacity and COP at your design temperature, the balance point, and what backup heat runs below it, with its kW.
- Whether the existing ducts were measured for airflow, and what the result was.
- What electrical work is needed, and who does the permit. If you’re unsure what permit applies, ask your local building department.
- For either system: what happens to any water heater that shares the flue.
General information, not professional, tax or legal advice. Prices, rebates and rules change, and your installer, utility, program or tax professional decides what applies to your home. Running-cost figures are our arithmetic from the sources linked and are estimates.
Sources checked on 4 November 2026.
Sources
- EIA Electric Power Monthly, Table 5.6.a, August 2026 (released 23 October 2026, preliminary)
- EIA Short-Term Energy Outlook, October 2026, Table 5b and electricity tables
- EIA weekly heating oil residential prices, 26 October 2026
- EIA weekly propane residential prices, 26 October 2026
- EIA: British thermal units
- EIA monthly residential natural gas prices, US and states
- EIA monthly natural gas deliveries to residential consumers, by state
- EIA natural gas prices: definitions and notes
- 10 CFR 430.32, energy conservation standards
- ENERGY STAR Version 6.2 heat pump specification, Rev. March 2025
- Carrier 27VNA1 product data, 27VNA1-02PD (maker)
- Carrier 59SC5B furnace product data, 59SC5B-06PD (maker)
- RDH: BC Cold Climate Heat Pump Study, Final Report (November 2020)
- CARB for DOE Building America: Field Performance of Inverter-Driven Heat Pumps in Cold Climates (August 2015)
- Efficiency Maine heat pump rebate brochure, as of 11 September 2026
- EIA RECS 2020, Table CE5.4.ST, space heating energy by state
- EIA Short-Term Energy Outlook, October 2026 overview
- DOE: Home Upgrades
- Rheem WP14AY product sheet (maker)
- ENERGY STAR Design Temperature Limit Reference Guide, 2015 edition, revised 2019
- EIA RECS 2020, Table HC6.6, space heating by climate region
- DOE final rule, consumer furnaces, 88 FR 87502 (18 December 2023)
- DOE notice on petition to amend furnace compliance date (27 April 2026)
- TECH Clean California cost study, Phase I findings (February 2024)
- Carrier: How much does a heat pump cost? (15 September 2026, maker's estimate)
- LBNL, Lutz et al.: residential furnaces, boilers and heat pump lifetimes (October 2011)
- PNNL and ORNL for DOE: HVAC, A Guide for Contractors to Share with Homeowners (August 2011)
- CEE Duct Retrofit Decision Guide for heat pump installers, on DOE's Building Science Education Solution Center
- 26 USC 25C
- DOE Program Notice 26-2, effective 29 May 2026
- Mass Save 2026 residential rebates, National Grid copy
- Mass Save 2026 air source heat pump rebate form, National Grid copy
- Efficiency Maine: ducted heat pump rebates
- EIA: Carbon dioxide emissions coefficients
- EIA FAQ: CO2 per kWh of US electricity generation (2023 data)
- EPA: Carbon monoxide's impact on indoor air quality
- CPSC: Carbon Monoxide Information Center
- ACCA: Manual J
- Mass Save: air source heat pumps, rebate page (read 4 November 2026)
- US Supreme Court: Order list, 8 June 2026, No. 25-879